Stabilizing Watchlist Report
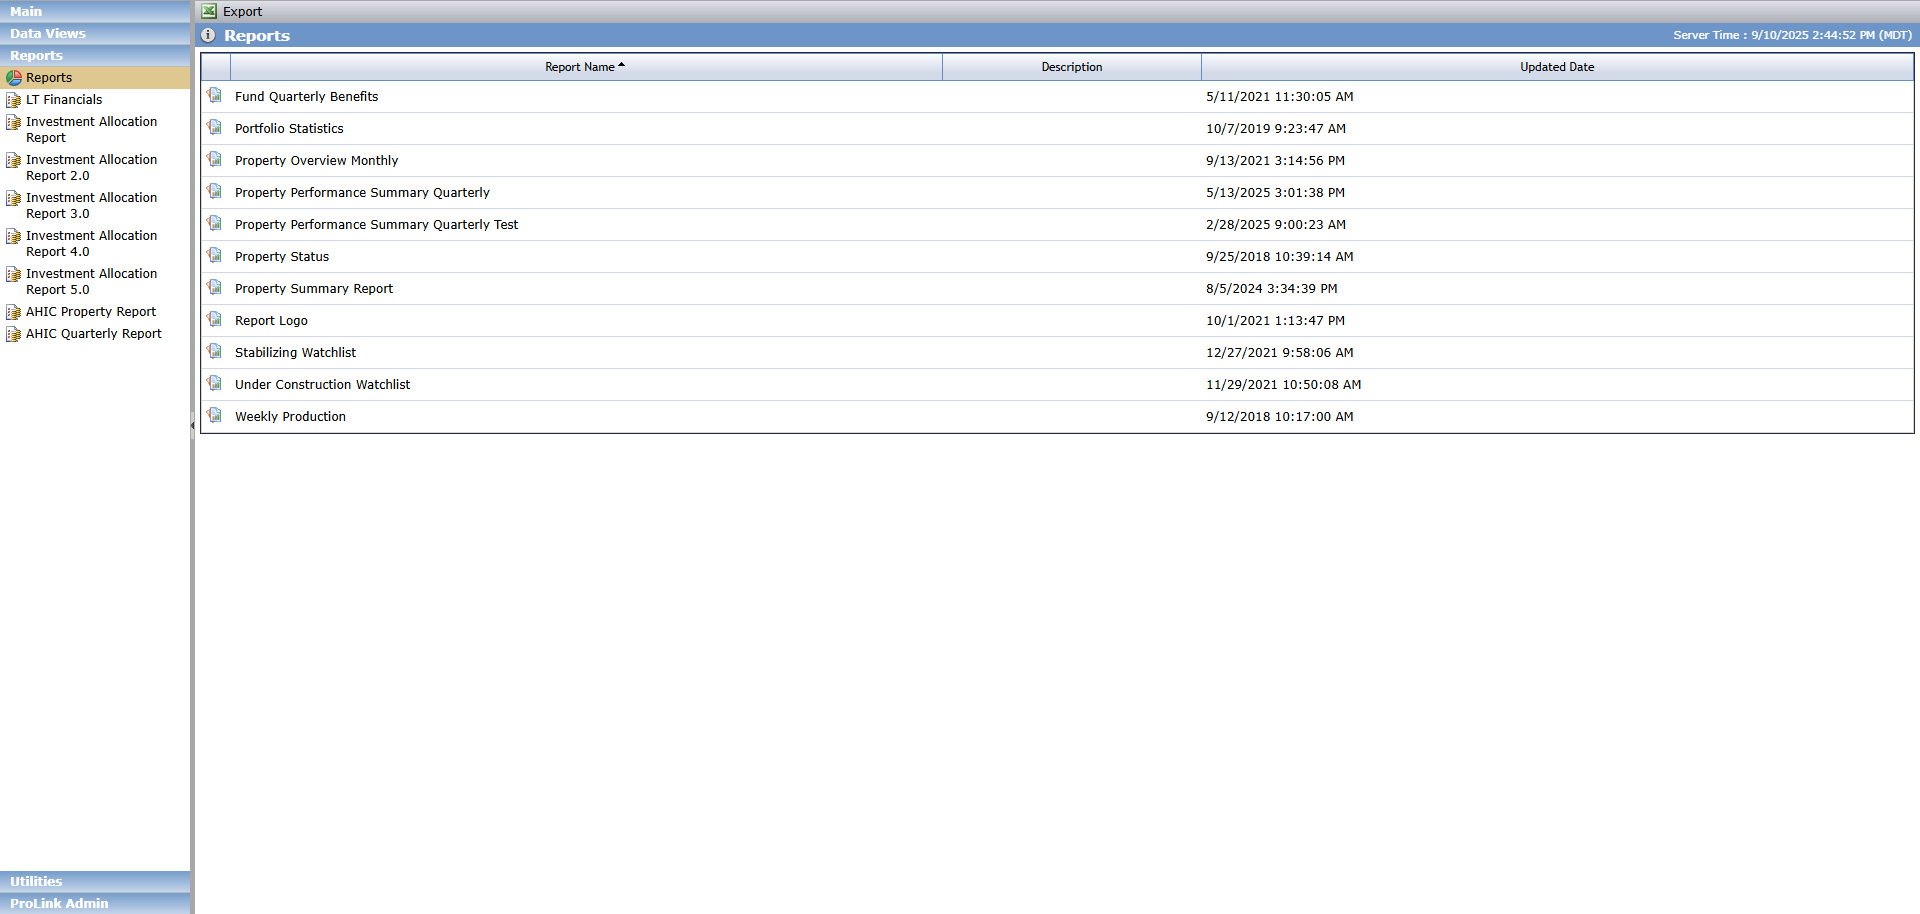
The Stabilizing Watchlist Report is available in the Reports section of the Reports panel.
The Stabilizing Watchlist Report provides details regarding the finances and occupancy of deals that are in stabilization. When the deal has a risk rating not equal to A or B, the report also includes any issues that are occurring and actions that need to be taken to remove the deal from the watchlist.
The Stabilizing Watchlist Report can be run for one specific Property or all Properties associated with a specific Fund or Organizational Portfolio. The data is displayed separately for each Property.
The report displays lower tier deals owned by funds directly or through a middle tier fund. Lower tier deals owned through a middle tier fund are only included when Include Child Funds equals Yes.
To generate the report:

Select whether to search by Property or Fund/Portfolio.
If searching by Property, select the property name.
OR
If searching by Fund/Portfolio, select the fund or portfolio name.
Select whether to include child funds in the results.
Select the Qtr End Month.
Select the Year.
Click View Report.
Save or print the report.
Field | Definition | |||
|---|---|---|---|---|
Quarter End Month | The date requested for the report, in MM/DD/YYYY format. | |||
Property Name | The Property Name. | |||
Location | The City and State from the Property - Main tab. | |||
Property Overview | ||||
Risk Rating Current Period | The Overall Rating on the most recent Risk Review record for the selected quarter, regardless of Risk Rating Status. NoteRisk Review records are by Year and Quarter. The report will use the most recent Year/Qtr for the year, based upon the FYEM on the Deal. For example, Report is requested for February 2018. Deal has a FYEM of December. There are Risk Review records for 2017 Q4 and 2018 Q1. The report will display the Overall Rating from the 2017 Q4 record. If the Deal has a FYEM of October, and the user requests a Report for May 2017, the Risk Review record for Q2 will be used for the report. Q1 Month end = January, Q2 Month end = April, Q3 Month end = July, Q4 Month end = October. | |||
Property Status | The Status from Property - Main tab. | |||
Number of Units | The Property Total Units from Property - Main tab. | |||
Physical Occupancy | The number of 10 Yr TC Units from Occupancy - Occupancy tab, for the quarter-end month selected for the report. | |||
Physical Occupancy Date | The quarter-end date in MM/YYYY format for the requested report date. | |||
GP/MM | The name of the Entity on the Deal with a Deal Role of General Partner. If there is no Entity with a Deal Role of General Partner this will display the name of the Entity with a Deal Role of Managing Member. | |||
Property Manager | The Active Associated Company with a Role of Property Manager. If there are multiples, the first one will be reported. | |||
PM Affiliate of GP/MM | If there is a Property Manager that is associated to the General Partner on the Deal Role then it shows Yes. If there is not a General Partner on the Deal, but there is Managing Member, and there is a Property Manager associated to the Managing Member, it will show Yes. | |||
Fund | Displays all active Entities on the Deal with a role of Syndicated Fund. | |||
Net Equity Committed | The Capital Amount from the Equity Schedule - Equity tab. | |||
Net Equity Disbursed | The total Adjusted Capital amount from the Equity Schedule - Equity tab, where Paid = Yes. | |||
Unfunded Equity | Displays the Total where Paid = No. | |||
Issues | Displays the Issues information from Risk Reviews, Investor Notes tab, for the corresponding Year and Quarter of the report. If the Risk Rating Current Period is A or B, this section will not display. | |||
Operating Performance Metrics | Selected Month/Year | Selected Month/Prior Year | Current Year Budget | Current Year Forecast Budget |
If the report is selected for the Month that is the Fiscal Year End Month for the deal, the Operating Performance Metrics for the Current YTD and Previous YTD columns will pull from the annual financials instead of the monthly financials IF the Status of the Annual financials is Received or Approved. Otherwise the report displays the monthly financials for the period selected. | If the report is selected for the Month that is the Fiscal Year End Month for the deal, the Operating Performance Metrics for the Current YTD and Previous YTD columns will pull from the annual financials instead of the monthly financials IF the Status of the Annual financials is Received or Approved. Otherwise, the report displays the monthly financials for the period selected. | |||
Total Revenue | The Total Income from Periodic Financial - Income Statement tab for the period selected for the report. | The Total Income from Periodic Financial - Income Statement tab for 1 year prior to the period selected for the report. | The Total Income from the Budget - Details tab, Budget column, for the year selected for the report. Calculation is based on the Quarter of the report: Quarter 1 = 25% of the annual amount. Quarter 2 = 50% of the annual amount. Quarter 3 = 75% of the annual amount. Quarter 4 = 100% of the annual amount. | The Total Income from the Budget - Details tab, Forecast column, for the year selected for the report. Calculation is based on the Quarter of the report: Quarter 1 = 25% of the annual amount. Quarter 2 = 50% of the annual amount. Quarter 3 = 75% of the annual amount. Quarter 4 = 100% of the annual amount. |
Total Operating Expenses | The Total Operating Expenses from Periodic Financial - Income Statement tab for the period selected for the report. Total Administrative Total Admin Payroll Total Management Fee Total Operations & Maintenance Total Maintenance Payroll Total Utilities Total Real Estate Taxes Total Insurance Total Other Expenses—this total excludes Personal Property, Incentive Management Fee, Investor Fee, and Other Non Recurring Items if those line items are included on the Financial record. | The Total Operating Expenses from Periodic Financial - Income Statement tab for 1 year prior to the period selected for the report. Total Administrative Total Admin Payroll Total Management Fee Total Operations & Maintenance Total Maintenance Payroll Total Utilities Total Real Estate Taxes Total Insurance Total Other Expenses—this total excludes Personal Property, Incentive Management Fee, Investor Fee, and Other Non Recurring Items if those line items are included on the Financial record. | The Total Operating Expenses from the Budget - Details tab, Budget column, for the year selected for the report. Total Administrative Total Admin Payroll Total Management Fee Total Operations & Maintenance Total Maintenance Payroll Total Utilities Total Real Estate Taxes Total Insurance Total Other Expenses—this total excludes Personal Property, Incentive Management Fee, Investor Fee, and Other Non Recurring Items if those line items are included on the Financial record. Calculation is based on the Quarter of the report: Quarter 1 = 25% of the annual amount. Quarter 2 = 50% of the annual amount. Quarter 3 = 75% of the annual amount. Quarter 4 = 100% of the annual amount. | The Total Operating Expenses from the Budget - Details tab, Forecast column, for the year selected for the report. Total Administrative Total Admin Payroll Total Management Fee Total Operations & Maintenance Total Maintenance Payroll Total Utilities Total Real Estate Taxes Total Insurance Total Other Expenses—this total excludes Personal Property, Incentive Management Fee, Investor Fee, and Other Non Recurring Items if those line items are included on the Financial record. Calculation is based on the Quarter of the report: Quarter 1 = 25% of the annual amount. Quarter 2 = 50% of the annual amount. Quarter 3 = 75% of the annual amount. Quarter 4 = 100% of the annual amount. |
NOI | NOI calculation: Total Revenue minus Total Operating Expenses. | NOI calculation: Total Revenue minus Total Operating Expenses. | NOI calculation: Total Revenue minus Total Operating Expenses. | NOI calculation: Total Revenue minus Total Operating Expenses. |
Debt Service | The Hard Debt Principal + Hard Debt Interest from Periodic Financial - Income Statement tab for the period selected for the report. | The Hard Debt Principal + Hard Debt Interest from Periodic Financial - Income Statement tab for 1 year prior to the period selected for the report. | The Hard Debt Principal + Hard Debt Interest from the Budget - Details tab, Budget column, for the year selected for the report. Calculation is based on the Quarter of the report: Quarter 1 = 25% of the annual amount. Quarter 2 = 50% of the annual amount. Quarter 3 = 75% of the annual amount. Quarter 4 = 100% of the annual amount. | The Hard Debt Principal + Hard Debt Interest from the Budget - Details tab, Forecast column, for the year selected for the report. Calculation is based on the Quarter of the report: Quarter 1 = 25% of the annual amount. Quarter 2 = 50% of the annual amount. Quarter 3 = 75% of the annual amount. Quarter 4 = 100% of the annual amount. |
Replacement Reserve | The Required Replacement Reserve Deposits amount from the Periodic/Annual Financial record for the period selected for the report. | The Required Replacement Reserve Deposits amount from the Periodic/Annual Financial record for the year prior to the period selected for the report. | The Required Replacement Reserve Deposits amount from the Budget - Details tab, Budget column for the year selected for the report. Calculation is based on the Quarter of the report: Quarter 1 = 25% of the annual amount. Quarter 2 = 50% of the annual amount. Quarter 3 = 75% of the annual amount. Quarter 4 = 100% of the annual amount. | The Required Replacement Reserve Deposits amount from the Budget - Details tab, Forecast column for the year selected for the report. Calculation is based on the Quarter of the report: Quarter 1 = 25% of the annual amount. Quarter 2 = 50% of the annual amount. Quarter 3 = 75% of the annual amount. Quarter 4 = 100% of the annual amount. |
Net Cash Flow | NOI minus Debt Service minus Required Replacement Reserves. | NOI minus Debt Service minus Required Replacement Reserves. | NOI minus Debt Service minus Required Replacement Reserves. | NOI minus Debt Service minus Required Replacement Reserves. |
Occupancy Grid | ||||
Reporting Period | Displays a listing of all Reporting Periods from the Lease Up tab. | |||
10 Year Tax Credit Units | Displays the sum of all 10 Yr Tax Credit Units across all buildings for the corresponding Reporting Period from the Lease Up tab. | |||
Forecast Units | Displays the Forecast Units from the Occupancy record for the corresponding Lease Up Reporting Period. | |||
Property Details | ||||
Date Closed | The Effective Date for Actual Closing from the Status History grid on Deal Details page. | |||
Placed In Service Date | The Actual PIS date from Edit Property - Main tab. | |||
End of Compliance | The LIHTC Compliance End Date from Property - LIHTC tab. | |||
Date of Last Site Visit | The Site Visit Date from the most recent Inspection record for the selected quarter for the Property from Inspection - Main tab. | |||
Property Type | The LIHTC Property Type from Property - LIHTC tab. | |||
Population Served | The Tenant Mix from Property - Main tab. | |||
Financing Information | ||||
Lender | The Lender name from Debt/Financing - Debt Details Main tab, for the Debt record that has an Order number of 1 and the Type is Construction Loan. | |||
Loan Type/Lien # | The Debt Instrument Type from Debt/Financing for the Debt record with Order of 1, followed by the Order # (1), and the Type is Construction Loan. | |||
Original Amount | The Actual Amount from Debt/Financing for the Debt record with Order of 1 and the Type is Construction Loan. | |||
Maturity Date | The best date available from the Maturity Stage. If an Actual Date is available, it will display that date, if no Actual Date is available it will display the Current Projected Date. If no Current Projected Date, it will display the Original Projected Date. Pulled from the Debt/Financing for the Debt record with a type of Construction Loan that has an Order of 1. | |||
Commitment Expires | The Commitment Expires Date from the Terms tab of Debt/Financing for the Debt record with a type of Construction Loan that has an Order of 1. | |||
# of Extensions | The # of Extensions Available from the Terms tab of Debt/Financing for the Debt record with a type of Construction Loan that has an Order of 1. | |||
Background | The Property Description from Property, Main tab. | |||
Market | Displays the Market information from Risk Reviews, Investor Notes tab, for the corresponding Year and Quarter of the report. | |||
Plan of Action | Displays the Actions information from Risk Reviews, Investor Notes tab, for the corresponding Year and Quarter of the report. If the Risk Rating Current Period is A or B, this section will not display. | |||
Project Status | Displays the Occupancy information from Risk Reviews, Investor Notes tab, for the corresponding Year and Quarter of the report. | |||