Property Overview Monthly Report
The Property Overview Monthly Report is available in the Reports section of the Reports panel.
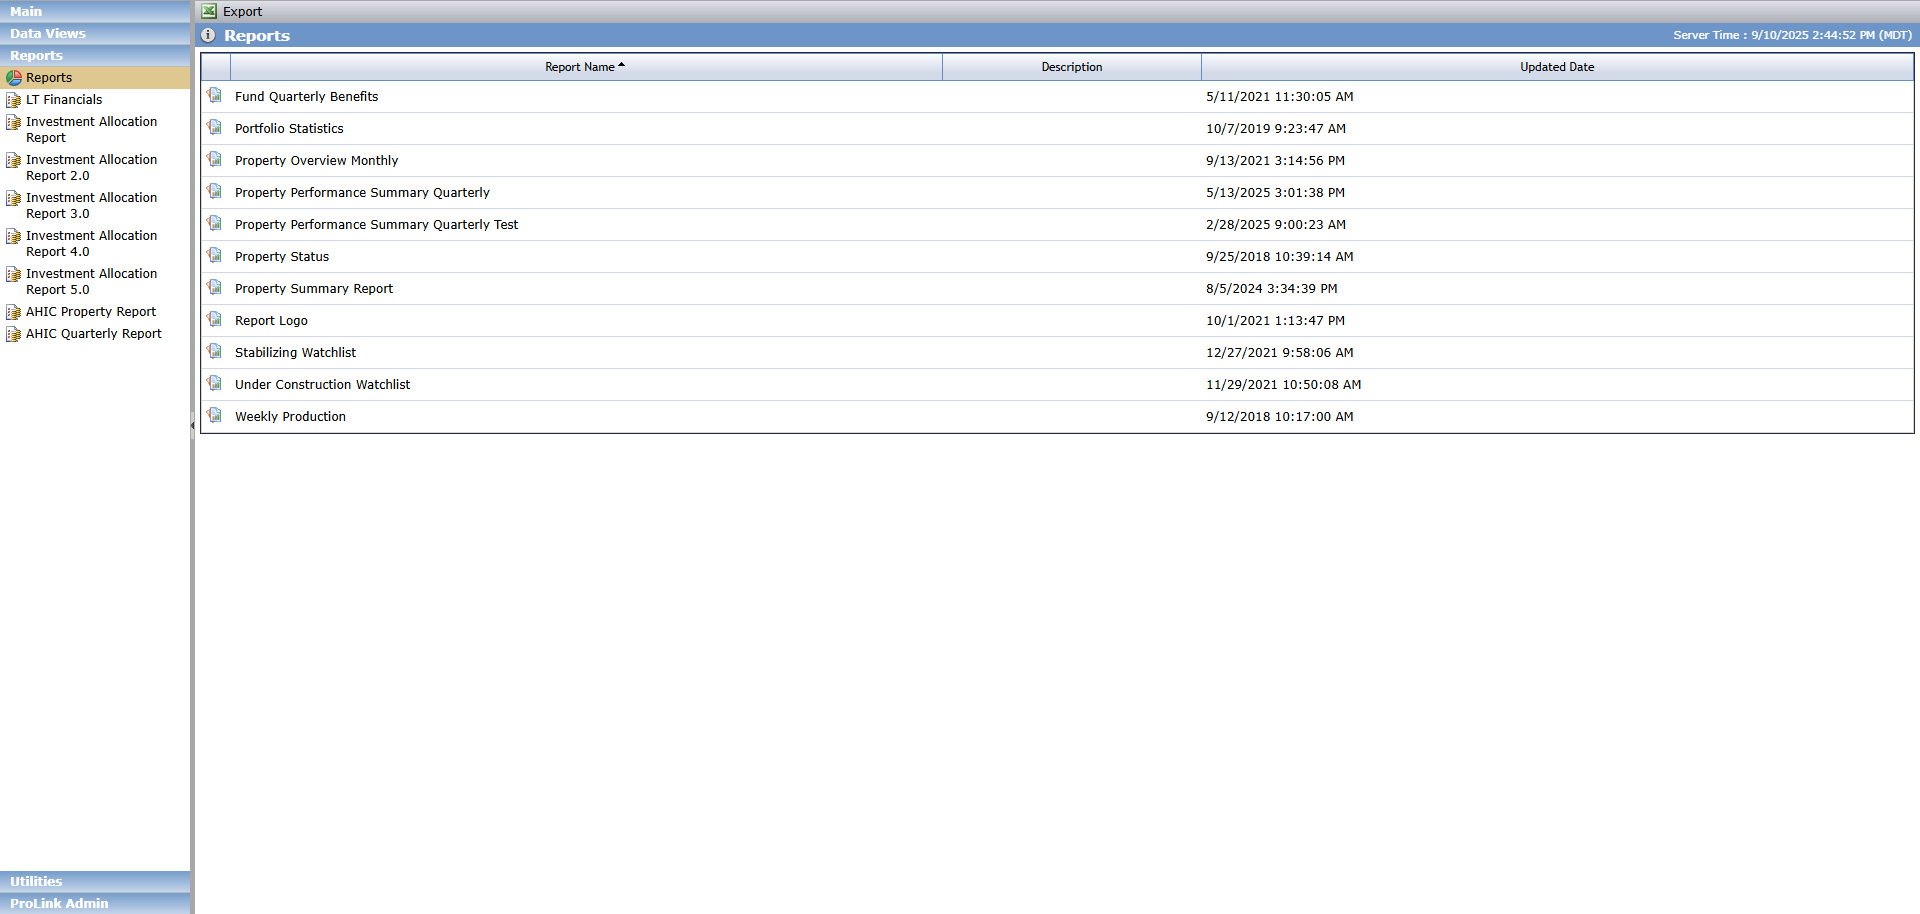
Typically, the Property Overview Monthly Report is run by Asset Managers while a project is in Construction. The report provides a snapshot of the deal property on a monthly basis. You can run the report for an individual property, or you can run the report by fund/portfolio to include all properties associated to the fund or organizational portfolio, for example to include property information in a fund quarterly report. The data is displayed separately for each property.
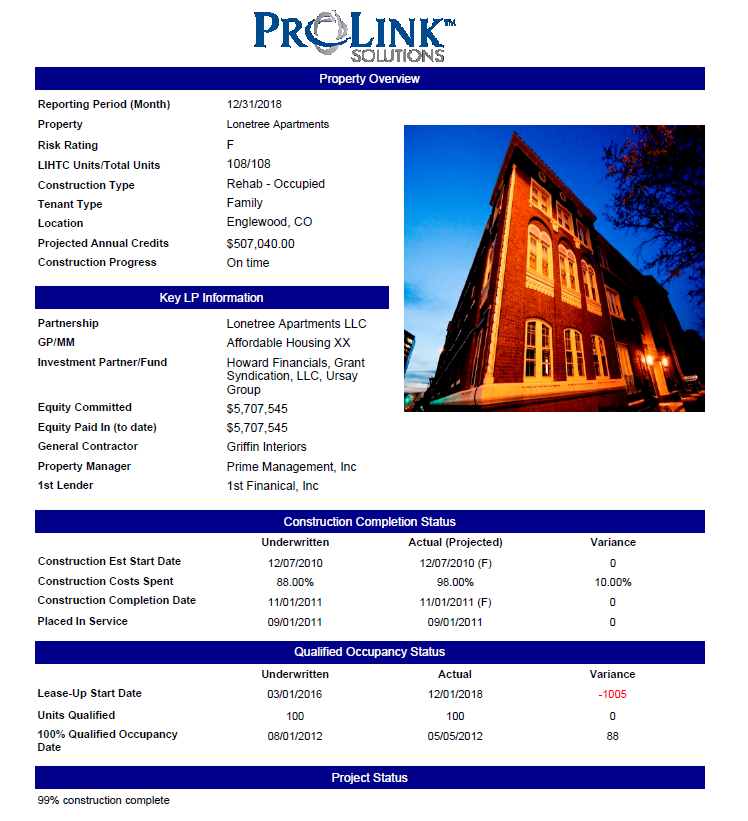
To generate the report:

Select whether to search by Property or Fund/Portfolio.
If searching by Property, select the property name.
OR
If searching by Fund/Portfolio, select the fund or portfolio name.
Select whether to include child funds in the results.
Select the Month.
Select the Year.
Click View Report.
Save or print the report.
Field | Definition | |||
|---|---|---|---|---|
Property Overview | ||||
Reporting Period (Month) | The date requested for the report, using the last day of the month selected, in mm/dd/yyyy format. | |||
Property | The property name. | |||
Risk Rating | The Overall Rating on the most recent Risk Review record for the selected month, regardless of Risk Rating Status. NoteRisk Review records are by Year and Quarter. The report will use the most recent Year/Qtr for the year, based upon the FYEM on the Deal. For example, Report is requested for February 2018. Deal has a FYEM of December. There are Risk Review records for 2017 Q4 and 2018 Q1. The report will display the Overall Rating from the 2017 Q4 record. If the Deal has a FYEM of October, and the user requests a Report for May 2017, the Risk Review record for Q2 will be used for the report. Q1 Month end = January, Q2 Month end = April, Q3 Month end = July, Q4 Month end = October. | |||
LIHTC Units/Total Units | LIHTC Units displays the Property Total TC Units from Property - Main tab. Total Units displays the Property Total Property Units from Property - Main tab. | |||
Construction Type | The Project Type on the Deal from the Property - Main tab. | |||
Tenant Type | The Tenant Mix on the Deal from the Property - Main tab. | |||
Location | The City and State from the Property - Main tab. | |||
Projected Annual Credits | The report will use the 8609 Annual Amount if available, if not then it will use the Cost Cert Annual Amount, if not then it will use the Forecasted Annual Amount. Displays the calculated amount of Ownership % for the entity with an owner role of Investor Member. If there is more than one with that role then the report will use the largest %. Report will not sum. If there is not an entity with an Owner Role of Investor Member then the report will use an Owner Role of Limited Partner, and will use the Ownership % of that entity. If there is more than one with that role the report will use the largest %. Report will not sum. NoteThe report will calculate the owner % using the Finalized Ownership Schedule. Projected Annual Credits amount will round to the nearest dollar. | |||
Construction Progress | Displays the Construction Progress from the Construction Budget. If there are multiple Construction Budgets the earliest Construction Budget will be used. | |||
Key LP Information | ||||
Partnership | The name of the Partnership on the Deal. | |||
GP/MM | The name of the Entity on the Deal with a Deal Role of General Partner. If there is no Entity with a Deal Role of General Partner this will display the name of the Entity with a Deal Role of Managing Member. | |||
Investment Partner/Fund | All active Entities on the Deal with a role of Syndicated Fund. | |||
Equity Committed | Displays from the Deal Equity Schedule. If Paid = Yes this will display the Capital Amount + Adjuster Applied amount. If Paid = No this will display the Capital Amount. | |||
Equity Paid In (to date) | Displays from the Deal Equity Schedule. If Paid = Yes this will display the Capital Amount + Adjuster Applied Amount. If Paid = No this will not be included. | |||
General Contractor | The Active Associated Company with a Role of General Contractor. If there are multiples, the first one will be reported. | |||
Property Manager | The Active Associated Company with a Role of Property Manager. If there are multiples, the first one will be reported. | |||
1st Lender | The name of the From (Lender) selected on Debt/Financing - Debt record that has the Order set to #1. If there is no Order #1, this will display blank. If multiple Debt records with Order #1 exist, the report displays the first one it finds. | |||
Construction Completion Status | ||||
The report output for this section varies depending on your organization. Version A of the report displays the Est Hard Costs Complete on Edit Draw for the corresponding month of the report. From Deal, Construction, Draws, Edit Draw - matches on Received Date. If multiple Draws exist for the month, the report will use the earliest date. Version B of the report shows the picture from the Construction Draw screen. The report shows the picture from the draw of the corresponding month of the report (Received Date). If multiple draws exist for the month, the report uses the picture from the earliest draw. | ||||
Qualified Occupancy Status | ||||
Underwritten | Actual (Projected) | Variance | ||
Lease-Up Start Date | Displays the Projected Lease-Up Start Date from Property - Main tab. | Displays the Actual Lease-Up Start Date from Property - Main tab. If the date is in the future it will be formatted with parentheses. | Displays the difference between the Underwritten and the Actual value. If the Actual Date is before the Underwritten Date the variance will show as a positive number. If the Actual Date is after the Underwritten Date the variance will show as a negative number. | |
Units Qualified | Displays the Forecast Units from Occupancy for the report month/year selected. | Displays the Actual Lease-Up Start Date from Property - Main tab. If the date is in the future it will be formatted with parentheses. | Displays the difference between the Actual and Underwritten values. | |
100% Qualified Occupancy Date | Displays the Projected 100% TC Occupancy from Property - Main tab. | Displays the Actual 100% TC Occupancy from Property - Main tab. | Displays the difference between the Underwritten and the Actual value. If the Actual Date is before the Underwritten Date the variance will show as a positive number. If the Actual Date is after the Underwritten Date the variance will show as a negative number. | |
Project Status | ||||
The Project Status section is populated based on whether the construction is finalized (Edit Property > Main tab > Actual Construction Completion Date: Final checkbox):
| ||||