Introduction to Unit Mix
The Unit Mix information is located under the Property Details menu option on a selected deal.
Note
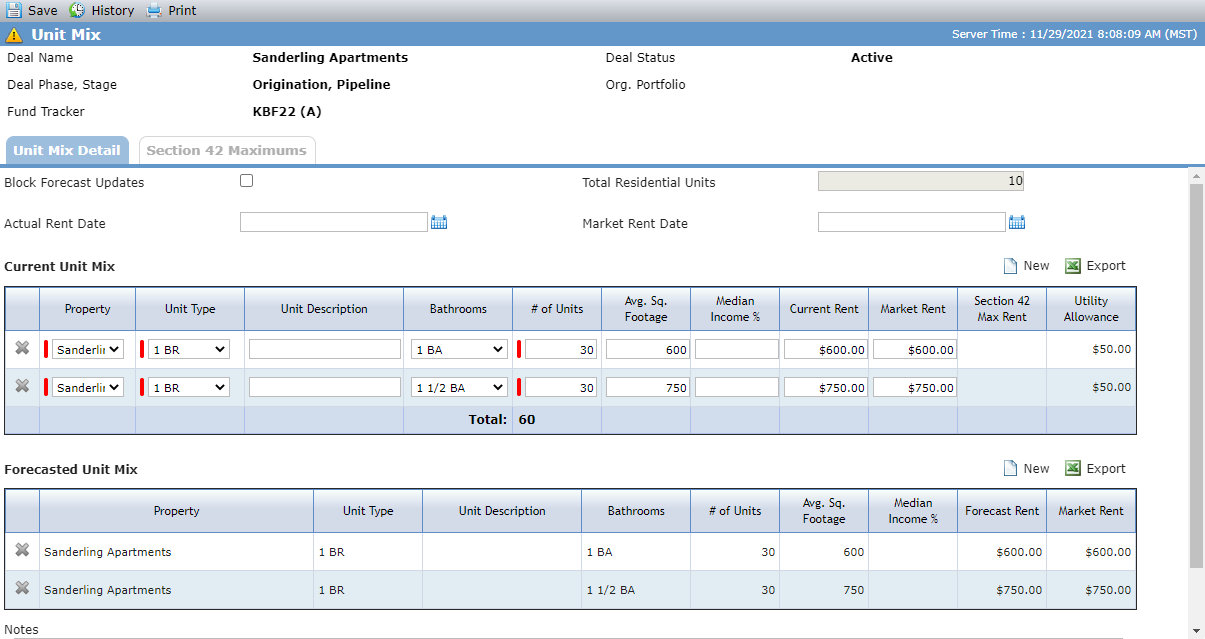
When the Block Forecast Updates checkbox is selected, the system does not update fields when a Financial Forecast SmartDox template is sent.
Current Unit Mix
The Current Unit Mix grid contains editable fields. To add a new current unit mix row, click New above the grid.
Column | Description |
|---|---|
Property | Required. The name of the property for the unit. |
Unit Type | Required. The number of bedrooms for the unit. |
Unit Description | Additional description of the unit type. |
Bathrooms | The number of bathrooms for the unit. |
# of Units | Required. The number of units that are occupied. |
Avg Sq. Footage | The average square footage for all the units that have the same bedroom, bathroom, and rent. |
Median Income % | The percentage of median income the unit's tenants can make to meet the required set-aside. |
Current Rent | The rent currently being charged for the unit. |
Market Rent | The rent that could be collected if the unit were a market rate unit. |
Section 42 Max Rent | Displays the most recently uploaded HUD Rent Limit for the percentage that corresponds to the minimum set-aside for the property from the Section 42 Maximum tab. |
Utility Allowance | Displays the utility allowance for the corresponding # of Bedrooms from the utility allowance on the Section 42 Maximums tab. |
Forecast Unit Mix
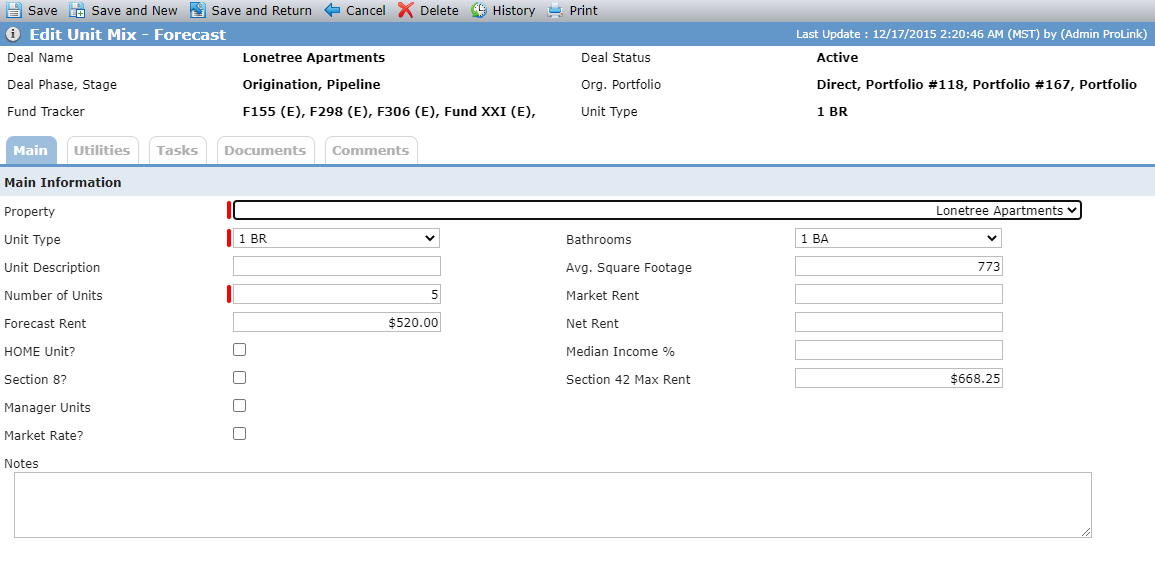
The values in the Forecasted Unit Mix grid are displayed from the Edit Unit Mix - Forecast screen. Click New above the grid to add a new forecast unit mix, or click a row to open the details for a specific forecast unit mix.
Column/Field | Description |
|---|---|
Property | Required. The name of the property for the unit. |
Unit Type | Required. The number of bedrooms for the unit. |
Unit Description | Additional description of the unit type. |
Bathrooms | The number of bathrooms for the unit. |
# of Units | Required. The number of units that are occupied. |
Avg Sq. Footage | The average square footage for all the units that have the same bedroom, bathroom, and rent. |
Median Income % | The percentage of median income the unit's tenants can make to meet the required set-aside. |
Forecast Rent | The rent that is forecast to be charged for the unit. |
Market Rent | The rent that could be collected if the unit were a market rate unit. |
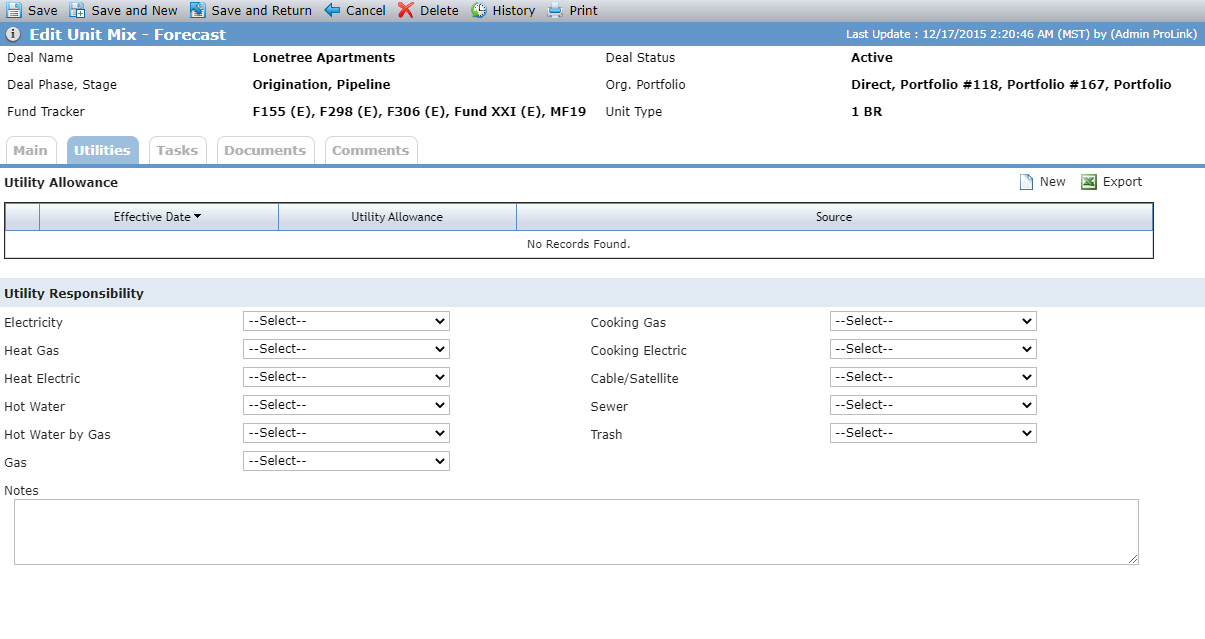
The Edit Unit Mix - Forecast screen includes the Utilities tab, which allows you to track the utility allowances and responsibilities by unit mix.
Section 42 Maximums
The Section 42 Maximums tab is displayed when LIHTC is selected as a program on the deal. A section is displayed for each property on the deal.
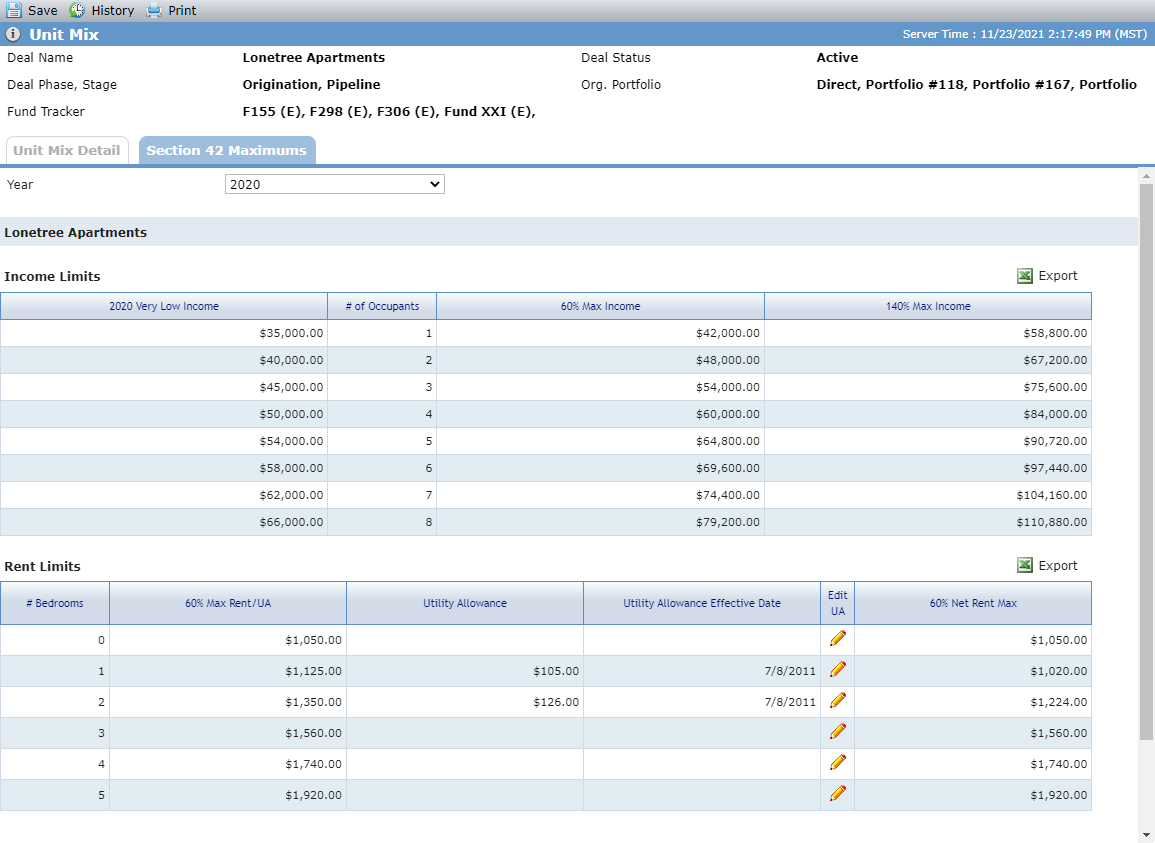
You can select a specific year in the Year list to filter the screen to the corresponding Income and Rent Limits. The list includes only those years where HUD Income and Rent Limits exist.
Data is displayed for a property if all of the following conditions are met:
At least one year of HUD Rent and Income Limits is imported (ProLink Admin>HUD Income Limits).
Actual PISD for the property is populated.
County for the property is populated.
State for the property is populated.
Column | Description |
|---|---|
Income Limits | |
<Year> Very Low Income | Displays either the HERA 50% AMI or non-HERA 50% AMI value for # Occupancy for the county/state of the property. If the property's Actual PISD is before 12/31/2008, the HERA values are used; otherwise, the non-HERA values are used. |
# of Occupants | The Income Limits grid always displays eight rows (1 - 8 occupants). |
<>% Max Income | The first Max Income column represents the minimum set-aside that was selected for the property. Displays the Very Low value times 2, times the Minimum Set-Aside % in the column header. |
<>% Max Income | The second Max Income column is always 140%. Displays 1.4 times Max Income for the Minimum Set-Aside % for the # of Occupants. |
<>% Max Income | Any additional set-asides that exist for the property are displayed as columns after the 140% Max Income column. Displays the Very Low value times 2, times the Additional Set-Aside %. |
Rent Limits | |
# Bedrooms | The Rent Limits grid always displays six rows (0 - 5 bedrooms). |
<>% Max Rent/UA | The first Max Rent/UA column represents the minimum set-aside that was selected for the property. Max Rent/UA is calculated as (<Percent of Income for Bedrooms> * 0.3/12) Where <Percent of Income for Bedrooms> is calculated from the Max Income column based upon the # Bedrooms and the associated Set-Aside:
|
<>% Max Rent/UA | Any additional set-asides that exist for the property are displayed as columns after the Minimum Set-Aside Max Rent column. |
Utility Allowance | Displays the value with the latest utility Allowance Effective Date for the corresponding # of Bedrooms. |
Utility Allowance Effective Date | Displays the latest Utility Allowance Effective Date for the corresponding # of Bedrooms. |
Edit UA | Clicking the |
<>% Net Rent Max | The first Net Rent column represents the minimum set-aside that was selected for the property. |
<>% Net Rent Max | Any additional set-asides that exist for the property are displayed as columns after the Minimum Set-Aside Net Rent column. |

Utility Allowances
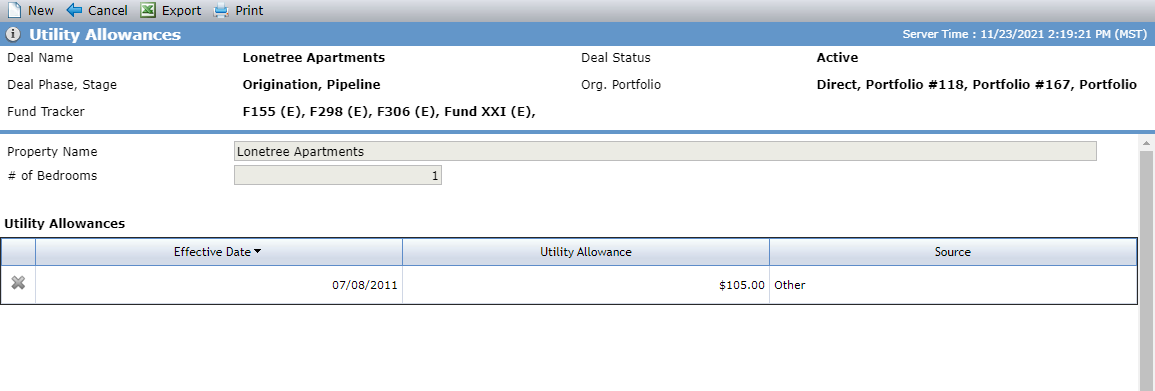
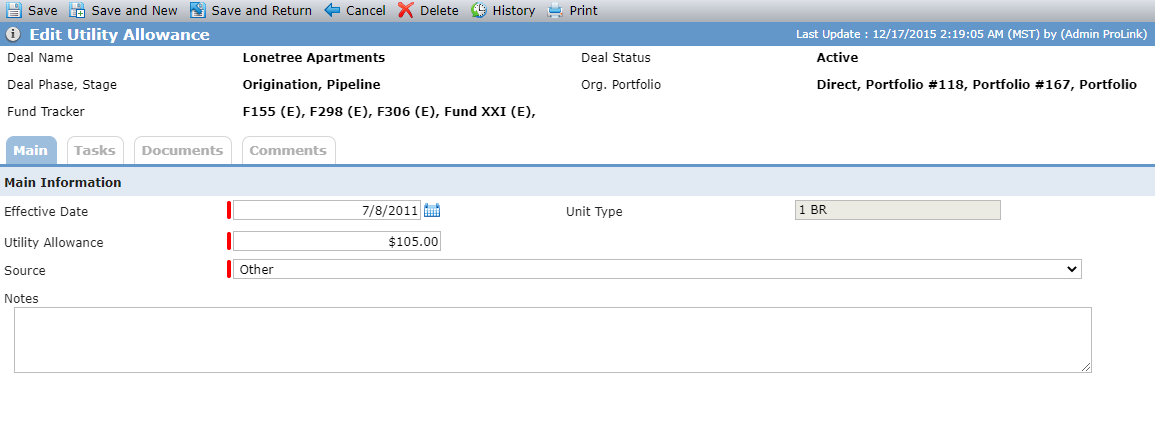
The Edit Utility Allowance screen is used for populating both current and forecast utility allowances. You can access the Utility Allowances screen by clicking a row in the Rent Limits grid on the Section 42 Maximums tab or the Utilities tab on the Edit Unit Mix - Forecast screen.
Utility Allowances list screen; Edit Utility Allowance screen