Dashboards
The BI (Business Intelligence) Dashboards link in the Main Menu provides access to system-wide analytics and reporting.
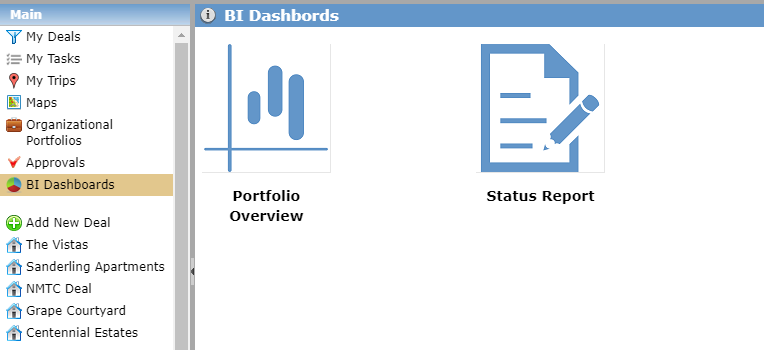
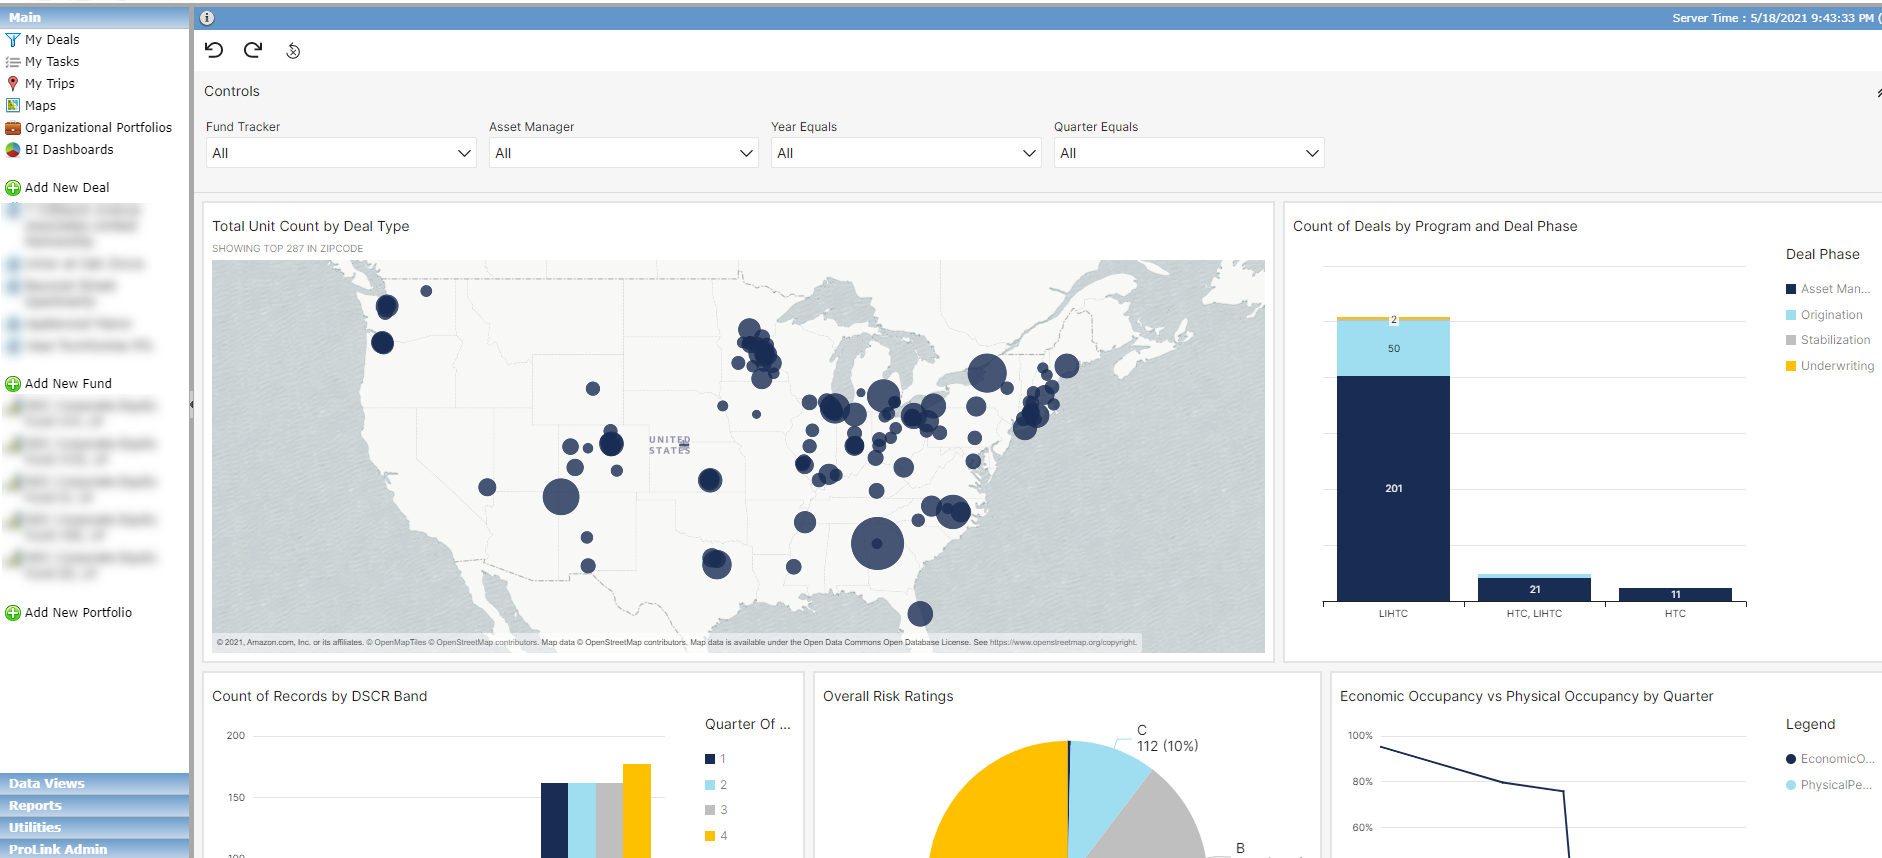
The Portfolio Overview dashboard displays overall portfolio-level information. You can filter this report and its charts by Fund, Asset Manager, Deal Type, and Time Periods (Year Equals, Quarter Equals). The charts do not factor in Deal Status; therefore, both active and inactive deals are included in chart data.
The charts are based on data that refreshes nightly. As a result, the charts do not reflect real-time data changes.
The information displayed is intended to give management an overall impression of how their portfolio is performing on a quarterly basis.
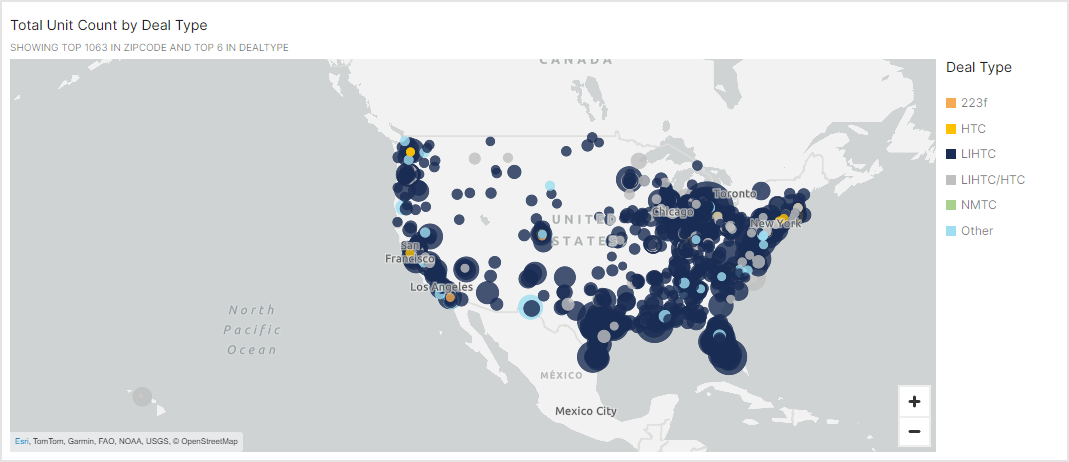
Total Unit Count by Deal Type
By default, the system uses all deals that belong to the six most popular Deal Types and displays Total Unit Counts on the map.
Filter | Details |
|---|---|
Fund Tracker | Displays deals that belong to the selected fund(s) only. |
Asset Manager | Displays deals that are managed by the selected Asset Manager(s) only. You can manage the assigned Asset Manager on the Assigned Users screen at the deal level. |
Deal Type | Displays deals with the selected Deal Type(s) only. |
Year Equals | Has no impact. |
Quarter Equals | Has no impact. |
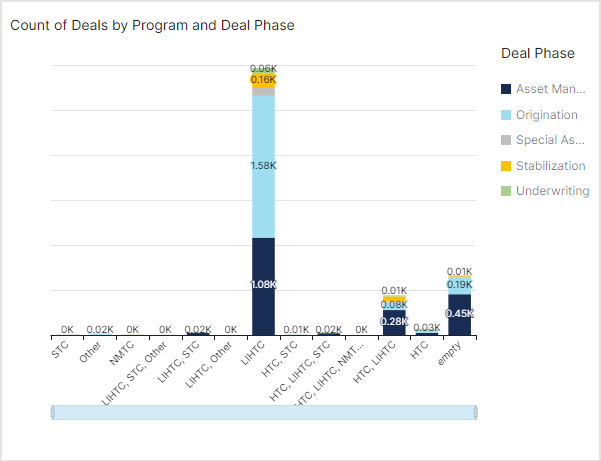
Count of Deals by Program and Deal Phase
The chart's X-axis displays all possible combinations of programs. The bars represent the number of deals belonging to each program. Each bar is subdivided based on Deal Phase.
Filter | Details |
|---|---|
Fund Tracker | Displays deals that belong to the selected fund(s) only. |
Asset Manager | Displays deals that are managed by the selected Asset Manager(s) only. You can manage the assigned Asset Manager on the Assigned Users screen at the deal level. |
Deal Type | Displays deals with the selected Deal Type(s) only. |
Year Equals | Has no impact. |
Quarter Equals | Has no impact. |
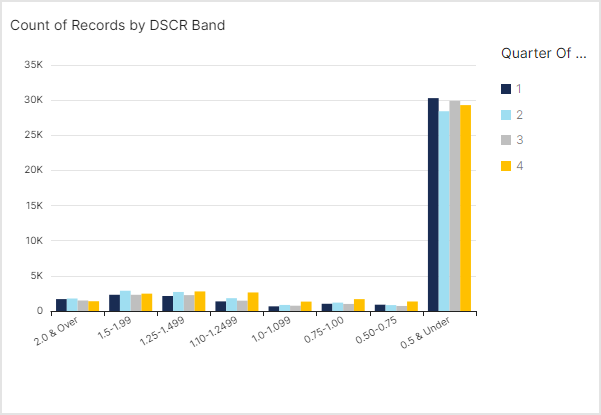
Count of Records by DSCR Band
By default, the chart displays all Debt Coverage Ratio (DSCR) stored in the system, meaning that if a deal has multiple financials stored (and thus multiple DSCRs calculated and stored), then the chart displays all DSCRs for the deal. For the chart to be meaningful, we recommend you use one of the time filters (Year Equals, Quarter Equals).
Filter | Details |
|---|---|
Fund Tracker | Displays deals that belong to the selected fund(s) only. |
Asset Manager | Displays deals that are managed by the selected Asset Manager(s) only. You can manage the assigned Asset Manager on the Assigned Users screen at the deal level. |
Deal Type | Displays deals with the selected Deal Type(s) only. |
Year Equals | Displays DSCR Band based on financials created during the selected year. |
Quarter Equals | Displays DSCR Band based on financials created during the selected quarter of the selected year. |
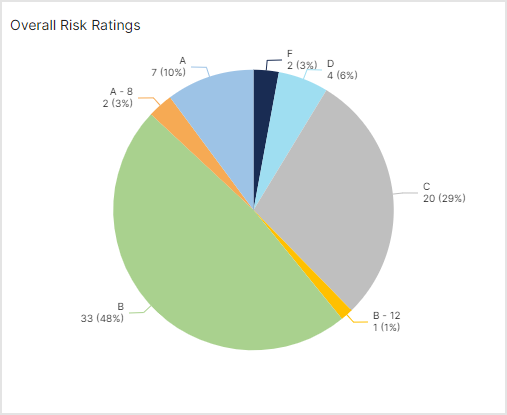
Overall Risk Ratings
By default, the chart displays all Risk Ratings ever created in the system across all deals. For the chart to be meaningful, we recommend you set the exact quarter based on a combination of the time filters—Year Equals and Quarter Equals.
Filter | Details |
|---|---|
Fund Tracker | Displays deals that belong to the selected fund(s) only. |
Asset Manager | Displays deals that are managed by the selected Asset Manager(s) only. You can manage the assigned Asset Manager on the Assigned Users screen at the deal level. |
Deal Type | Displays deals with the selected Deal Type(s) only. |
Year Equals | Displays the Risk Rating performed within the selected year. |
Quarter Equals | Displays the Risk Rating performed within the selected quarter of the selected year. |
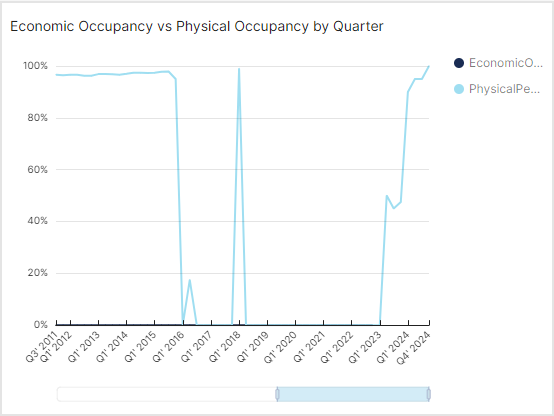
Economic Occupancy vs Physical Occupancy by Quarter
By default, the chart displays median values of the quarterly Economic Occupancy rates and quarterly Physical Occupancy rates ever created in the system across all deals. The time filters are not relevant for this chart, meaning the chart's X-axis displays the timeline that contains occupancy rates regardless of time filters.
Filter | Details |
|---|---|
Fund Tracker | Displays deals that belong to the selected fund(s) only. |
Asset Manager | Displays deals that are managed by the selected Asset Manager(s) only. You can manage the assigned Asset Manager on the Assigned Users screen at the deal level. |
Deal Type | Displays deals with the selected Deal Type(s) only. |
Year Equals | Has no impact. |
Quarter Equals | Has no impact. |
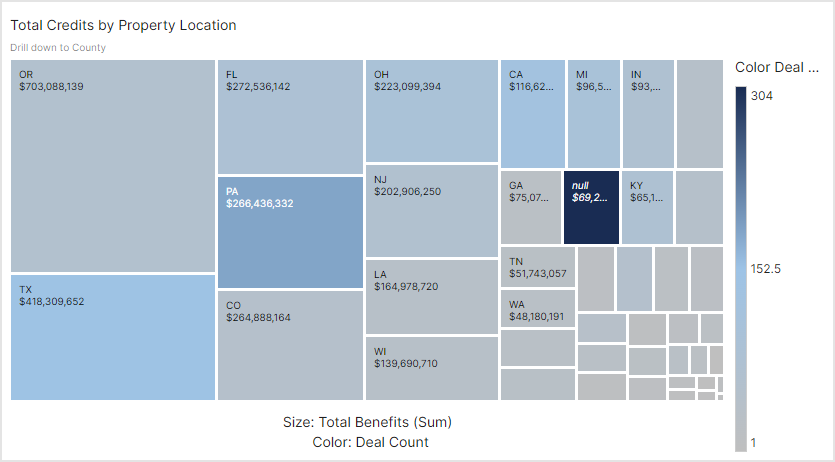
Total Credits by Property Location
By default, the chart displays the sum of total tax benefit amounts of each deal, grouped by the deal's geographic location (state level, and you can drill down to the county level).
Filter | Details |
|---|---|
Fund Tracker | Displays deals that belong to the selected fund(s) only. |
Asset Manager | Displays deals that are managed by the selected Asset Manager(s) only. You can manage the assigned Asset Manager on the Assigned Users screen at the deal level. |
Deal Type | Displays deals with the selected Deal Type(s) only. |
Year Equals | Has no impact. |
Quarter Equals | Has no impact. |
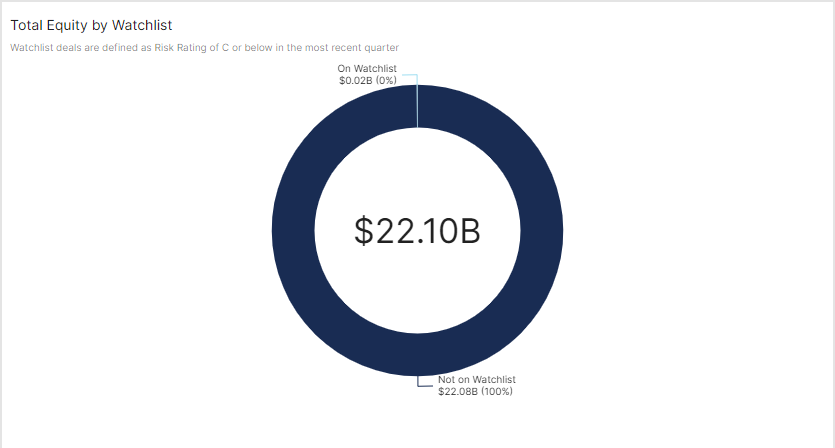
Total Equity by Watchlist
By default, the chart displays the sum of total equity (that is, capital contributions) of each deal, summed by two different groups—Not on Watchlist and On Watchlist. Deals that have the latest risk rating of C or below are considered to be on the watchlist, regardless of the time filters. The chart only uses the latest risk rating, which is displayed in the Deal Risk Rating field on the deal's Overview screen. Time filters are not relevant for this chart.
Filter | Details |
|---|---|
Fund Tracker | Displays deals that belong to the selected fund(s) only. |
Asset Manager | Displays deals that are managed by the selected Asset Manager(s) only. You can manage the assigned Asset Manager on the Assigned Users screen at the deal level. |
Deal Type | Displays deals with the selected Deal Type(s) only. |
Year Equals | Has no impact. |
Quarter Equals | Has no impact. |
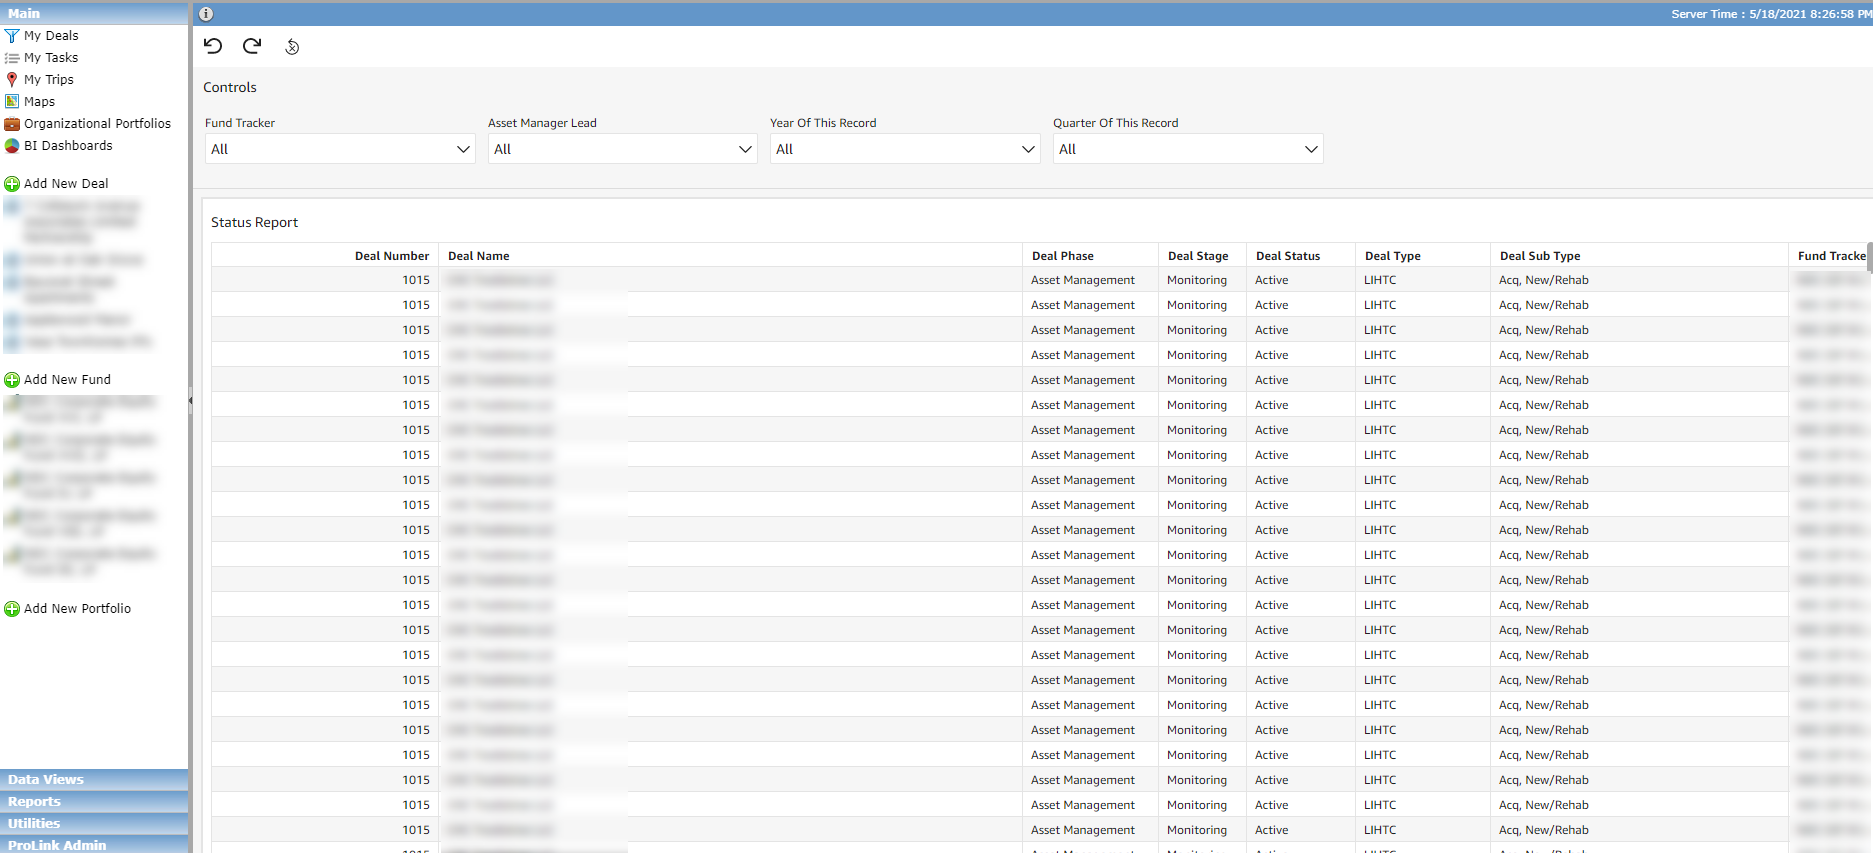
The Status Report dashboard displays data points across multiple data views. You can filter the report by Fund, Asset Manager, and Time Periods to access a detailed view into your portfolio. Export the report to CSV or Microsoft Excel to remove any extraneous columns and slice and dice the data as needed.